2 Usage
2.1 Overview
The two major components of the Event Tracer (ET) tool is a graphical sequence chart viewer (et_viewer) and its backing storage (et_collector). One collector may be used as backing storage for several simultaneous viewers where each one may display a different view of the same trace data.
The interface between the collector and its viewers is public in order to enable other types of viewers. However in the following text we will focus on usage of the et_viewer.
The main start function is et_viewer:start/1. It will by default start both an et_collector and an et_viewer:
         % erl -pa et/examples
         Erlang (BEAM) emulator version 2002.10.08 [source]

         Eshell V2002.10.08  (abort with ^G)
         1> {ok, Viewer} = et_viewer:start([]).
         {ok,<0.31.0>}
A viewer gets trace events from its collector by polling it regularly for more events to display. Trace events are for example reported to the collector with et_collector:report_event/6:
         2> Collector = et_viewer:get_collector_pid(Viewer).
         <0.30.0>
         3> et_collector:report_event(Collector, 60, my_shell, mnesia_tm, start_outer,
                                      "Start outer transaction"),
         3> et_collector:report_event(Collector, 40, mnesia_tm, my_shell, new_tid,
                                      "New transaction id is 4711"),
         3> et_collector:report_event(Collector, 20, my_shell, mnesia_locker, try_write_lock,
                                      "Acquire write lock for {my_tab, key}"),
         3> et_collector:report_event(Collector, 10, mnesia_locker, my_shell, granted,
                                      "You got the write lock for {my_tab, key}"),
         3> et_collector:report_event(Collector, 60, my_shell, do_commit,
                                      "Perform  transaction commit"),
         3> et_collector:report_event(Collector, 40, my_shell, mnesia_locker, release_tid,
                                      "Release all locks for transaction 4711"),
         3> et_collector:report_event(Collector, 60, my_shell, mnesia_tm, delete_transaction,
                                      "End of outer transaction"),
         3> et_collector:report_event(Collector, 20, my_shell, end_outer,
                                      "Transaction returned {atomic, ok}").
         {ok,{table_handle,<0.30.0>,11,trace_ts,#Fun<et_collector.0.83904657>}}
         4>
This is a simulation of the process events caused by a Mnesia transaction that writes a record in a local table:
mnesia:transaction(fun() -> mnesia:write({my_tab, key, val}) end).
At this stage when we have a couple of events, it is time to show how it looks like in the graphical interface of et_viewer:
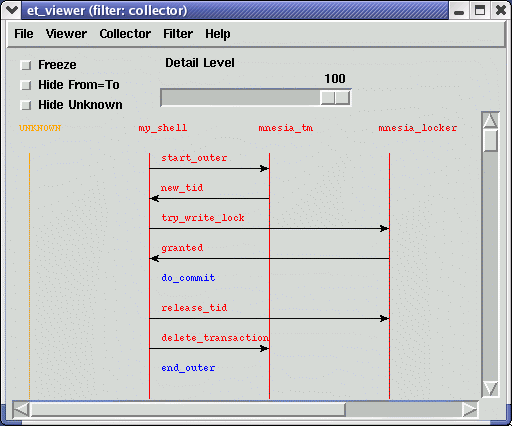
Figure 2.1: A simulated Mnesia transaction which writes one record
In the sequence chart, the actors (which symbolically has performed the traced event) are shown as named vertical bars. The order of the actors may be altered by dragging (hold mouse button 1 pressed during the operation) the name tag of an actor and drop it elsewhere:

Figure 2.2: Two actors has switched places
An event may be an action performed by one single actor (blue text label) or it may involve two actors and is then depicted as an arrow directed from one actor to another (red text label). Details of an event can be shown by clicking (press and release the mouse button 1) on the event label text or on the arrow:
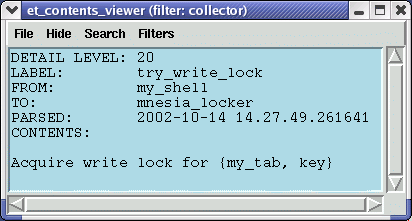
Figure 2.3: Details of a write lock message
2.2 Filters and dictionary
The Event Tracer (ET) uses named filters in various contexts. An Event Trace filter is an Erlang fun that takes some trace data as input and returns a possibly modified version of it:
         filter(TraceData) -> true | {true, NewEvent} | false

         TraceData = NewEvent | term()
         NewEvent  = record(event)
The interface of the filter function is the same as the the filter functions for the good old lists:zf/2. If the filter returns false it means that the TraceData should be dropped. {true, NewEvent} means that the TraceData should be replaced with NewEvent. And true means that the TraceData data already is an event record and that it should be kept as it is.
The first filter that the trace data is exposed for is the collector filter. When a trace event is reported with et_collector:report/2 (or et_collector:report_event/5,6) the first thing that happens, is that a message is sent to the collector process to fetch a handle that contains some useful stuff, such as the collector filter fun and an ets table identifier. Then the collector filter fun is applied and if it returns true (or {true, NewEvent}), the event will be stored in an ets table. As an optimization, subsequent calls to et_collector:report-functions can use the handle directly instead of the collector pid.
The collector filter (that is the filter named collector) is a little bit special, as its input may be any Erlang term and is not limited to take an event record as the other filter functions.
The collector manages a key/value based dictionary, where the filters are stored. Updates of the dictionary is propagated to all subscribing processes. When a viewer is started it is registered as a subscriber of dictionary updates.
In a viewer there is only one filter that is active and all trace events that the viewer gets from the collector will pass thru that filter. By writing clever filters it is possible to customize how the events looks like in the viewer. The following filter replaces the actor names mnesia_tm and mnesia_locker and leaves everything else in the record as it was:
If we now add the filter to the running collector:
        4> Fun = fun(E) -> et_demo:mgr_actors(E) end.
        #Fun<erl_eval.5.123085357>
        5> et_collector:dict_insert(Collector, {filter, mgr_actors}, Fun).
        ok
        6>
you will see that the Filter menu in all viewers have got a new entry called mgr_actors. Select it, and a new viewer window will pop up:
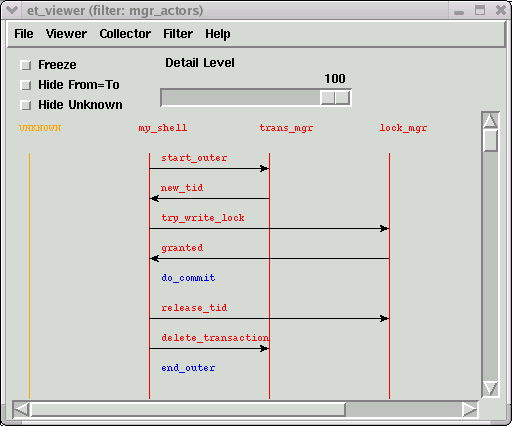
Figure 2.4: The same trace data in a different view
In order to see the nitty gritty details of an event you may click on the event in order to start a contents viewer for that event. In the contents viewer there is also a filter menu in order to enable inspection of the event from other views than the one selected in the viewer. A click on the new_tid event will cause a contents viewer window to pop up, showing the event in the mgr_actors view:
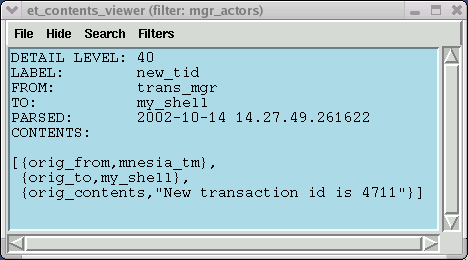
Figure 2.5: The trace event in the mgr_actors view
Select the collector entry in the Filters menu and a new contents viewer window will pop up showing the same trace event in the collectors view:
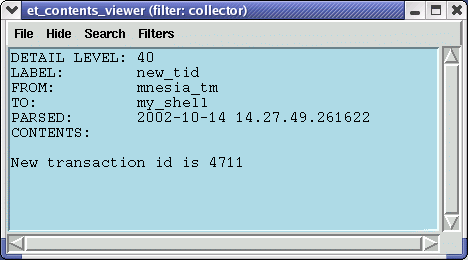
Figure 2.6: The same trace event in the collectors view
2.3 Trace clients
As you have seen it is possible to use the et_collector:report-functions explicitly. By using those functions you can write your own trace client that reads trace data from any source stored in any format and just feed the collector with it. You may replace the default collector filter with a filter that converts new exciting trace data formats to event-records or you may convert it to an event-record before you invoke et_collector:report/2 and then rely on the default collector filter to handle the new format.
There are also existing functions in the API that reads from various sources and calls et_collector:report/2:
-
The trace events that are hosted by the collector may be stored to file and later be loaded by selecting save and load entries in the viewers File-menu or via the et_collector API.
-
It is also possible to perform live tracing of a running system by making use of the built-in trace support in the Erlang emulator. These Erlang traces can be directed to files or to ports. See the reference manual for erlang:trace/4, erlang:trace_pattern/3, dbg and ttb for more info.
There are also corresponding trace client types that can read the Erlang trace data format from such files or ports. The et_collector:start_trace_client/3 function makes use of these Erlang trace clients and redirects the trace data to the collector.
The default collector filter converts the Erlang trace data format into event-records.If you want to perform this differently you can of course write your own collector filter from scratch. But it may probably save you some efforts if you first apply the default filter in et_selector:parse_event/2 before you apply your own conversions of its output.
2.4 Global tracing and phone home
Setting up an Erlang tracer on a set of nodes and connecting trace clients to the ports of these tracers is not intuitive. In order to make this it easier the Event Tracer as a notion of global tracing. When used, the et_collector process will monitor Erlang nodes and when one connects, an Erlang tracer will automatically be started on the other node. A corresponding trace client will also be started on the collector node in order to automatically forward the trace events to the collector. Set the boolean parameter trace_global to true for either the et_collector or et_viewer in order to activate the global tracing. There is no restriction on how many concurrent (anonymous) collectors you can have, but you can only have one global collector as its name is registered in global.
In order to further simplify the tracing you can make use of the et:report_event/4,5 (or its equivalents et:phone_home/4,5 :-). These functions are intended to be invoked from other applications when there are interesting events, in your application that needs to be highlighted. The functions are extremely light weight as they do nothing besides returning an atom. These functions are specifically designed to be traced for. As the caller explicitly provides the values for the event-record fields, the default collector filter is able to automatically provide a customized event-record without any user defined filter functions.
In normal operation the et:report_event/4,5 calls are almost for free. When tracing is needed you can either activate tracing on these functions explicitly. Or you can combine the usage of trace_global with the usage of trace_pattern. When set, the trace_pattern will automatically be activated on all connected nodes.
One nice thing with the trace_pattern is that it provides a very simple way of minimizing the amount of generated trace data by allowing you to explicitly control the detail level of the tracing. As you may have seen the et_viewer have a slider called "Detail Level" that allows you to control the detail level of the trace events displayed in the viewer. On the other hand if you set a low detail level in the trace_pattern, lots of the trace data will never be generated and thus not sent over the socket to the trace client and stored in the collector.
2.5 Viewer window
Almost all functionality available in the et_viewer is also available via shortcuts. Which key that has the same effect as selecting a menu entry is shown enclosed in parentheses. For example pressing the key r is equivalent to selecting the menu entry Viewer->Refresh.
File menu:
-
Close Collector and all Viewers - Close the collector and all viewers connected to that collector.
-
Close other Viewers, but keep Collector - Keep this viewer and its collector, but close all other viewers connected to this collector.
-
Close this Viewer, but keep Collector - Close this viewer, but all other viewers and the collector.
-
Save Collector to file - Save all events stored in the collector to file.
-
Load Collector from file - Load the collector with events from a file.
Viewer menu:
-
First - Scroll this viewer to the first collector event.
-
Prev - Scroll this viewer one "page" backwards. Normally this means that the first event displayed in the viewer will be the last one and the previous max_events events will be read from the collector.
-
Next - Scroll this viewer one "page" forward. Normally this means that the last event displayed in the viewer will be the first one and max_events more events will be read from the collector.
-
Last - Scroll this viewer to the last collector event.
-
Refresh - Clear this viewer and re-read its events from the collector.
-
Up 5 - Scroll 5 events backwards.
-
Down 5 - Scroll 5 events forward.
-
Abort search. Display all. - Switch the display mode to show all events regardless of any ongoing searches. Abort the searches.
Collector menu:
-
First - Scroll all viewers to the first collector event.
-
Prev - Scroll all viewers one "page" backwards. Normally this means that the first event displayed in the viewer will be the last one and the previous max_events events will be read from the collector.
-
Next - Scroll all viewers one "page" forward. Normally this means that the last event displayed in the viewer will be the first one and max_events more events will be read from the collector.
-
Last - Scroll all viewers to the last collector event.
-
Refresh - Clear all viewers and re-read their events from the collector.
Filters menu:
-
ActiveFilter (=) - Start a new viewer window with the same active filter and scale as the current one.
-
ActiveFilter (+) - Start a new viewer window with the same active filter but a larger scale than the current one.
-
ActiveFilter (-) - Start a new viewer window with the same active filter but a smaller scale than the current one.
-
collector (0) - Start a new viewer with the collector filter as active filter.
-
AnotherFilter (2) - If more filters are inserted into the dictionary, these will turn up here as entries in the Filters menu. The second filter will be number 2, the next one number 3 etc. The names are sorted.
Slider and radio buttons:
-
Freeze - When true, this means that the viewer will not read more events from the collector until set to false.
-
Hide From=To - When true, this means that the viewer will hide all events where the from-actor equals to its to-actor.
-
Hide Unknown - When true, this means that the viewer will hide all events where either of the from-actor or to-actor is UNKNOWN.
-
Detail level - This slider controls the resolution of the viewer. Only events with a detail level smaller than the selected one (default=100=max) are displayed.
Other features:
-
Display details of an event - Click on the event name and a new window will pop up, displaying the contents of an event.
-
Toggle actor search - Normally the viewer will be in a display mode where all events are shown. By clicking on an actor name the tool will switch display mode to only show events with selected actors.
Click on an actor and only events with that actor will be displayed. Click on another actor to include that actor to the selected ones. Clicking on an already selected actor will remove it from the collections of selected actors. When the collection of selected actors becomes empty the normal mode where all actors are shown will be entered again.
Abort actor search with the a key or with the Viewer->Abort search menu choice.
-
Move actor - Drag and drop an actor by first clicking on the actor name, keeping the button pressed while moving the cursor to a new location and release the button where the actor should be moved to.
2.6 Configuration
The event-records in the ets-table are ordered by their timestamp. Which timestamp that should be used is controlled via the event_order parameter. Default is trace_ts which means the time when the trace data was generated. event_ts means the time when the trace data was parsed (transformed into an event-record).
2.7 Contents viewer window
File menu:
-
Close - Close this window.
-
Save - Save the contents of this window to file.
Filters menu:
-
ActiveFilter - Start a new contents viewer window with the same active filter.
-
AnotherFilter (2) - If more filters are inserted into the dictionary, these will turn up here as entries in the Filters menu. The second filter will be number 2, the next one number 3 etc. The names are sorted.
Hide menu:
-
Hide actor in viewer - Known actors are shown as a named vertical bars in the viewer window. By hiding the actor, its vertical bar will be removed and the viewer will be refreshed.
Hiding the actor is only useful if the max_actors threshold has been reached, as it then will imply that the "hidden" actor will be displayed as if it were "UNKNOWN". If the max_actors threshold not have been reached, the actor will re-appear as a vertical bar in the viewer.
-
Show actor in viewer - This implies that the actor will be added as a known actor in the viewer with its own vertical bar.
Search menu:
-
Forward from this event - Set this event to be the first event in the viewer and change its display mode to be enter forward search mode. The actor of this event (from, to or both) will be added to the list of selected actors.
-
Reverse from this event - Set this event to be the first event in the viewer and change its display mode to be enter reverse search mode. The actor of this event (from, to or both) will be added to the list of selected actors. Observe, that the events will be shown in reverse order.
-
Abort search. Display all - Switch the display mode of the viewer to show all events regardless of any ongoing searches. Abort the searches.